NOTES:
|
Back to top: MNI: Quick-start Guide
Quick-start Guide
The Multinodal Indices (MNI) introduce a network visualization as a way to explore the bibliographical information on our site. They are not a mature tool yet; we include them here because they reveal the importance of connections between ideas and sources in multiplanar writing, and because the complexity of multiplanar discourse can be aided by algorithmic tools such as the MNI.
What follows is a basic introduction to the Keyword and Author multinodal visualizations. These visualizations are most useful for topics and authors that occupy an intermediate level of relevance in our bibliography: where there are too many or too few connections, the network visualization is either trivial or too complex to be intuitively understandable. Where there is an intermediate amount of connections, these indices immediately reveal structures that could not be discovered through traditional linear indices.
Network representation of the structure of bibliographical information offers other opportunities, and further complexities, as well. Interested readers can find more details at the page linked below this introduction.
Back to top: MNI: Quick-start Guide
Keyword Index
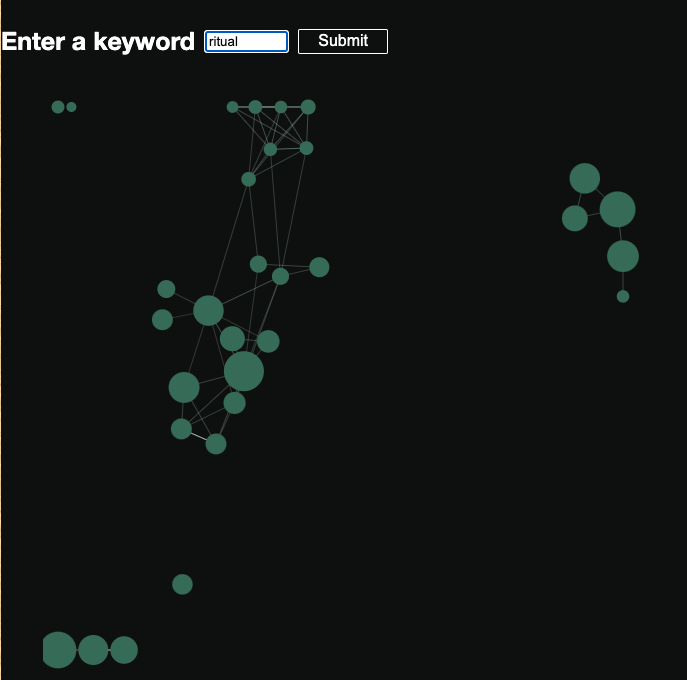
The network representation of keywords shared among bibliography entries offers a way to notice groups of bibliography entries that address similar topics. If we search the term ‘ritual’, we see this:
The network structure gives us an intuitive impression that corresponds well to the contents of the bibliography. The largest node in the largest cluster refers to the chapter on religion and magic in von Soden’s classic Introduction to the Study of the Ancient Near East. The more tightly connected components of that cluster deal with the topic of ritual and religion in the ANE, whereas less tightly connected components are more specialized: most of the seven-node cluster at the top of the image deals with the namburbi. There are also two unconnected clusters that contain works about other religious traditions, the traditions of Çatalhöyük and Christianity.
In this case, the network visualization offers a guide to the content of the bibliography which can enrich the work of the researcher: it indicates that the current bibliography focuses on the ANE, while considering other traditions as well, and directs the researcher to the clusters of relevant works, whereas a linear index does not reveal the subclusters of works that contain a given keyword.
For details about how the keyword representation is produced, and for considerations about its strengths and weaknesses, see here.
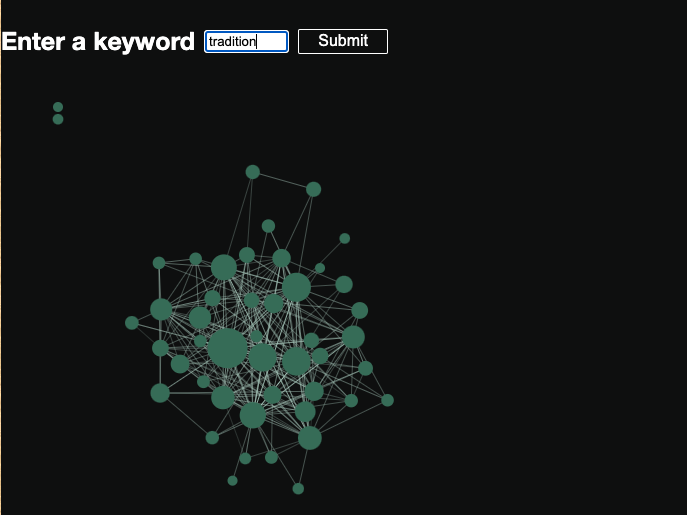
In other cases, the network visualization does not add much to the experience that could be had by using the traditional linear index. For instance, searching for the word “tradition” returns a densely connected cluster of related works that is essentially identical to the linear index.
The only additional information in this case is found in the two unconnected nodes, which reference Diels-Kranz’s Presocratic fragments and the Database of Religious History, which indeed are tangential to the main contents of the site. In many queries, unconnected nodes appear at the periphery of the visualization without links to the core cluster. These nodes refer to elements in the bibliography that contain the search term, but do not share more than five keywords with any of the other works. They can be interpreted as “hapax” elements which are not corroborated by other sources in our bibliography. (It should be noted that in all cases, the content of the linear and multinodal indices is determined not by the works themselves, but by the summaries and keyword tags our research team has produced.)
Back to top: MNI: Quick-start Guide
Author Index
The Author “keyword space” visualization shows a network of keywords found in the bibliography, filtered by author. In some cases, this visualization is either too simple or too complex to be of use as an intuitive guide. If there is only one work by an author in the bibliography (as is the case with the majority of authors), the keyword space visualization is no more useful than a simple word cloud. At the other extreme, if there are too many works by an author, the visualization is too complex to admit intuitive use—see for instance Buccellati’s graph, which is highly complex because the bibliography contains 28 entries on his works. This level of complexity requires mathematical network analysis to provide useful information.
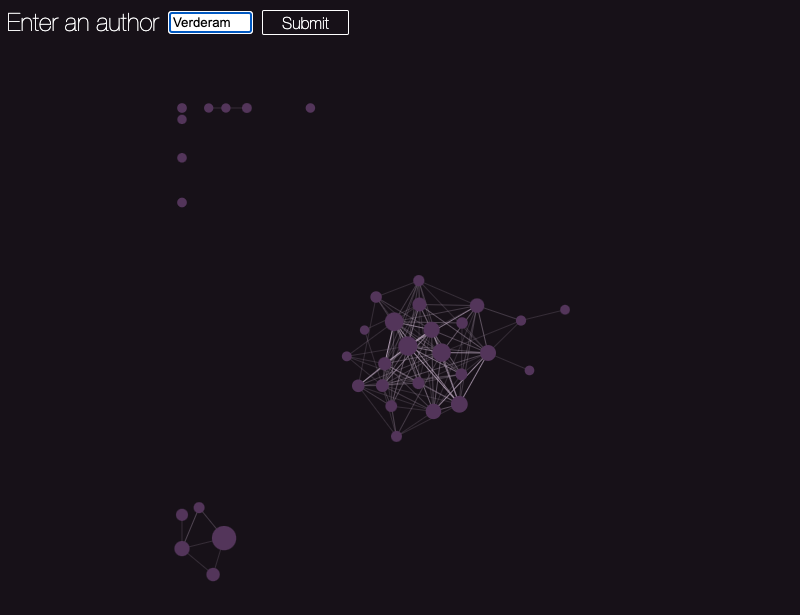
However, the Author keyword space visualization is useful in intermediate cases. For instance, Verderame’s network appears thus:
From this image we can deduce that Verderame’s interests cluster into discrete groups that do not share keywords. This reflects the contents of the bibliography, which contains three of his articles on very different issues: magic and divination, calendars and measuring time, and writing. We also notice eight unconnected nodes in the top left corner, which represent keywords that are not present in more than one of his articles, and therefore are not connected to the rest of the network.
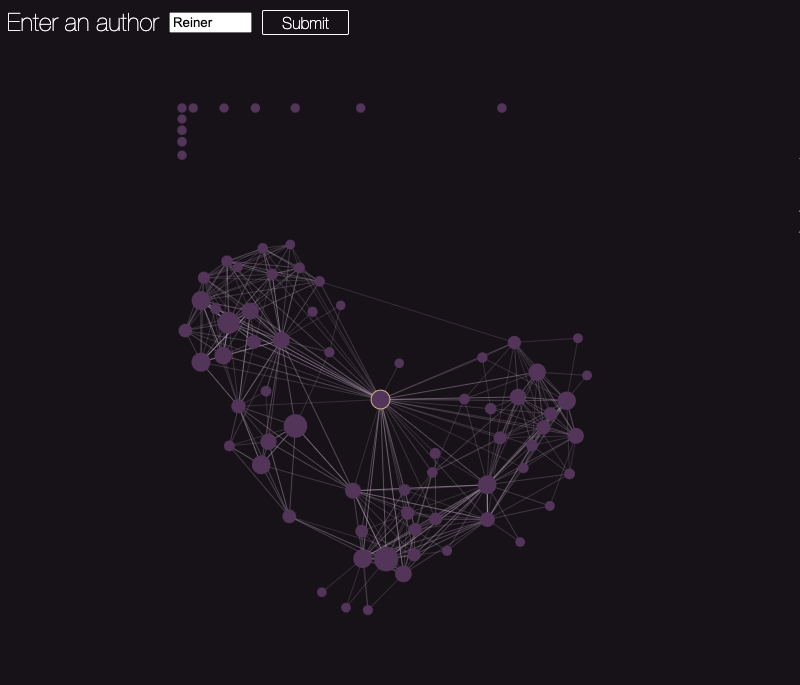
In the case of Erica Reiner, we see a more complex and well-connected graph:
Reiner also covers a variety of topics: Šurpu incantations, the “seven sages”, wisdom literature, and poetry. But in her case, these topics share keywords and present as a connected graph. We can further notice that the topic that holds most of this network together is the word “king” (highlighted in the image).
Back to top: MNI: Quick-start Guide


